
# 10 May 2005 # # Though gnuplot is primarily a scientific plotting program, it can do a great # job of plotting finance charts as well. The primary challenge is the irregular # nature of financial time series. Stocks don't trade every day, so when you set # the x-axis to time gaps appear for non-trading days. Investors and traders # generally prefer that these gaps be omitted. Another challenge is that finance # charts are best presented in semi-log form (log y-axis, linear x-axis), # but gnuplot wants to span decades in its log scaling, something that stocks # rarely do. These and other challenges are met in finance.dem, a short # demonstration script that proves that gnuplot can really shine in this area. # # gnuplot plays a central role in our work. Almost all the graphs in "Bollinger # on Bollinger Bands" were plotted by gnuplot, many gnuplot visuals have # appeared on CNBC, our in-house analytics use gnuplot for visual display and # The Capital Growth Letter relies heavily on gnuplot for its charts. # # Finally, gnuplot is yet another successful demonstration of a powerful idea, # open source programming. Thanks to all who made gnuplot possible from the # earliest days to the present and to all those who will contribute in the # future. (Special thanks to Hans-Bernhard Broeker whose patience helped me to # climb the grade and to Ethan Merritt whose recent contributions have been # invaluable to our work.) # # John Bollinger # www.BollingerBands.com # a demonstration of gnuplot finance plot styles # by John Bollinger, CFA, CMT # www.BollingerBands.com # BBands@BollingerBands.com # data and indicators in finance.dat # data file layout: # date, open, high, low, close, volume, # 50-day moving average volume, Intraday Intensity, # 20-day moving average close, # upper Bollinger Band, lower Bollinger Band # last update: 8 May 2005Click here for minimal script to generate this plot

reset # set label 1 "Demo of plotting financial data" at screen 0.5, screen 0.95 center set title "Demo of plotting financial data" set yrange [75:105] set ytics (105, 100, 95, 90, 85, 80) set xrange [50:253] set lmargin 9 set rmargin 2 plot 'finance.dat' using 0:5 notitle with linesClick here for minimal script to generate this plot
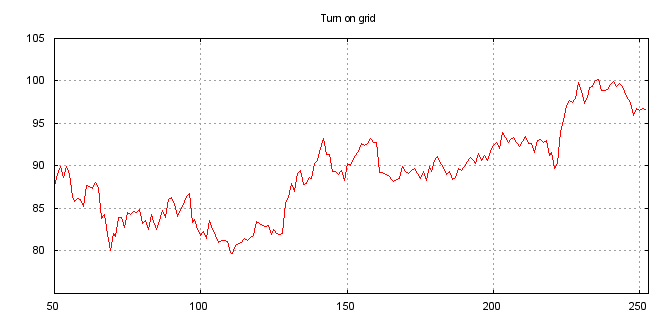
reset set title "Turn on grid" set yrange [75:105] set ytics (105, 100, 95, 90, 85, 80) set xrange [50:253] set lmargin 9 set rmargin 2 set grid plot 'finance.dat' using 0:5 notitle with linesClick here for minimal script to generate this plot

reset set title "Semi-log scaling" set yrange [75:105] set ytics (105, 100, 95, 90, 85, 80) set xrange [50:253] set lmargin 9 set rmargin 2 set grid set logscale y plot 'finance.dat' using 0:5 notitle with linesClick here for minimal script to generate this plot

reset set title "Finance bars" set yrange [75:105] set ytics (105, 100, 95, 90, 85, 80) set xrange [50:253] set lmargin 9 set rmargin 2 set grid set logscale y plot 'finance.dat' using 0:2:3:4:5 notitle with financebars lt 8Click here for minimal script to generate this plot

reset set title "Bollinger Bands" set yrange [75:105] set ytics (105, 100, 95, 90, 85, 80) set xrange [50:253] set lmargin 9 set rmargin 2 set grid set logscale y plot 'finance.dat' using 0:2:3:4:5 notitle with financebars lt 8, \ 'finance.dat' using 0:9 notitle with lines lt 3, \ 'finance.dat' using 0:10 notitle with lines lt 1, \ 'finance.dat' using 0:11 notitle with lines lt 2Click here for minimal script to generate this plot

reset set title "Overlay an indicator on a separate scale" set yrange [75:105] set ytics (105, 100, 95, 90, 85, 80) set xrange [50:253] set lmargin 9 set rmargin 2 set grid set logscale y plot 'finance.dat' using 0:2:3:4:5 notitle with financebars lt 8, \ 'finance.dat' using 0:9 notitle with lines lt 3, \ 'finance.dat' using 0:10 notitle with lines lt 1, \ 'finance.dat' using 0:11 notitle with lines lt 2, \ 'finance.dat' using 0:8 axes x1y2 notitle with lines lt 4Click here for minimal script to generate this plot
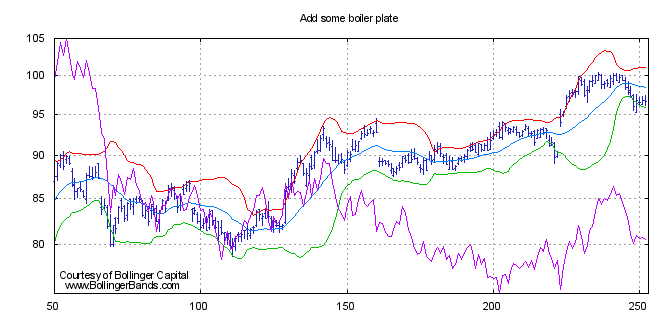
reset set title "Add some boiler plate" set label "Courtesy of Bollinger Capital" at graph 0.01, 0.07 set label " www.BollingerBands.com" at graph 0.01, 0.03 set yrange [75:105] set ytics (105, 100, 95, 90, 85, 80) set xrange [50:253] set lmargin 9 set rmargin 2 set grid set logscale y plot 'finance.dat' using 0:2:3:4:5 notitle with financebars lt 8, \ 'finance.dat' using 0:9 notitle with lines lt 3, \ 'finance.dat' using 0:10 notitle with lines lt 1, \ 'finance.dat' using 0:11 notitle with lines lt 2, \ 'finance.dat' using 0:8 axes x1y2 notitle with lines lt 4Click here for minimal script to generate this plot

reset set label "Courtesy of Bollinger Capital" at graph 0.01, 0.07 set label " www.BollingerBands.com" at graph 0.01, 0.03 set logscale y set yrange [75:105] set ytics (105, 100, 95, 90, 85, 80) set xrange [50:253] set grid set lmargin 9 set rmargin 2 set format x "" set xtics (66, 87, 109, 130, 151, 174, 193, 215, 235) set multiplot set size 1, 0.7 set origin 0, 0.3 set bmargin 0 set title "Add volume in a separate clip" plot 'finance.dat' using 0:2:3:4:5 notitle with financebars lt 8, \ 'finance.dat' using 0:9 notitle with lines lt 3, \ 'finance.dat' using 0:10 notitle with lines lt 1, \ 'finance.dat' using 0:11 notitle with lines lt 2, \ 'finance.dat' using 0:8 axes x1y2 notitle with lines lt 4 unset label 1 unset label 2 unset title set bmargin set format x set size 1.0, 0.3 set origin 0.0, 0.0 set tmargin 0 unset logscale y set autoscale y set format y "%1.0f" set ytics 500 plot 'finance.dat' using 0:($6/10000) notitle with impulses lt 3 unset multiplotClick here for minimal script to generate this plot

reset set label "Courtesy of Bollinger Capital" at graph 0.01, 0.07 set label " www.BollingerBands.com" at graph 0.01, 0.03 set logscale y set yrange [75:105] set ytics (105, 100, 95, 90, 85, 80) set xrange [50:253] set grid set lmargin 9 set rmargin 2 set format x "" set xtics (66, 87, 109, 130, 151, 174, 193, 215, 235) set multiplot set title "Add average volume" set size 1, 0.7 set origin 0, 0.3 set bmargin 0 plot 'finance.dat' using 0:2:3:4:5 notitle with financebars lt 8, \ 'finance.dat' using 0:9 notitle with lines lt 3, \ 'finance.dat' using 0:10 notitle with lines lt 1, \ 'finance.dat' using 0:11 notitle with lines lt 2, \ 'finance.dat' using 0:8 axes x1y2 notitle with lines lt 4 unset label 1 unset label 2 unset title set bmargin set format x set size 1.0, 0.3 set origin 0.0, 0.0 set tmargin 0 unset logscale y set autoscale y set format y "%1.0f" set ytics 500 plot 'finance.dat' using 0:($6/10000) notitle with impulses lt 3, \ 'finance.dat' using 0:($7/10000) notitle with lines lt 1 unset multiplotClick here for minimal script to generate this plot

reset
set label "Courtesy of Bollinger Capital" at graph 0.01, 0.07
set label "  www.BollingerBands.com" at graph 0.01, 0.03
set logscale y
set yrange [75:105]
set ytics (105, 100, 95, 90, 85, 80)
set xrange [50:253]
set grid
set lmargin 9
set rmargin 2
set format x ""
set xtics (66, 87, 109, 130, 151, 174, 193, 215, 235)
set multiplot
set title "Add date labels to the x axis"
set size 1, 0.7
set origin 0, 0.3
set bmargin 0
plot 'finance.dat' using 0:2:3:4:5 notitle with financebars lt 8, \
'finance.dat' using 0:9 notitle with lines lt 3, \
'finance.dat' using 0:10 notitle with lines lt 1, \
'finance.dat' using 0:11 notitle with lines lt 2, \
'finance.dat' using 0:8 axes x1y2 notitle with lines lt 4
unset label 1
unset label 2
unset title
set bmargin
set format x
set size 1.0, 0.3
set origin 0.0, 0.0
set tmargin 0
unset logscale y
set autoscale y
set format y "%1.0f"
set ytics 500
set xtics ("6/03" 66, "7/03" 87, "8/03" 109, "9/03" 130, "10/03" 151, "11/03" 174, "12/03" 193, "1/04" 215, "2/04" 235)
plot 'finance.dat' using 0:($6/10000) notitle with impulses lt 3, \
'finance.dat' using 0:($7/10000) notitle with lines lt 1
unset multiplot


Click here for minimal script to generate this plot

reset
set label "Courtesy of Bollinger Capital" at graph 0.01, 0.07
set label "  www.BollingerBands.com" at graph 0.01, 0.03
set logscale y
set yrange [75:105]
set ytics (105, 100, 95, 90, 85, 80)
set xrange [50:253]
set grid
set lmargin 9
set rmargin 2
set format x ""
set xtics (66, 87, 109, 130, 151, 174, 193, 215, 235)
set multiplot
set title "Add labels for each clip"
set size 1, 0.7
set origin 0, 0.3
set bmargin 0
set ylabel "price" offset 1
plot 'finance.dat' using 0:2:3:4:5 notitle with financebars lt 8, \
'finance.dat' using 0:9 notitle with lines lt 3, \
'finance.dat' using 0:10 notitle with lines lt 1, \
'finance.dat' using 0:11 notitle with lines lt 2, \
'finance.dat' using 0:8 axes x1y2 notitle with lines lt 4
unset label 1
unset label 2
unset title
set bmargin
set format x
set size 1.0, 0.3
set origin 0.0, 0.0
set tmargin 0
unset logscale y
set autoscale y
set format y "%1.0f"
set ytics 500
set xtics ("6/03" 66, "7/03" 87, "8/03" 109, "9/03" 130, "10/03" 151, "11/03" 174, "12/03" 193, "1/04" 215, "2/04" 235)
set ylabel "volume (0000)" offset 1
plot 'finance.dat' using 0:($6/10000) notitle with impulses lt 3, \
'finance.dat' using 0:($7/10000) notitle with lines lt 1
unset multiplot


Click here for minimal script to generate this plot

reset
set label 1 "Acme Widgets" at graph 0.5, graph 0.9 center front
set label 2 "Courtesy of Bollinger Capital" at graph 0.01, 0.07
set label 3 "  www.BollingerBands.com" at graph 0.01, 0.03
set logscale y
set yrange [75:105]
set ytics (105, 100, 95, 90, 85, 80)
set xrange [50:253]
set grid
set lmargin 9
set rmargin 2
set format x ""
set xtics (66, 87, 109, 130, 151, 174, 193, 215, 235)
set multiplot
set title "Add a title"
set size 1, 0.7
set origin 0, 0.3
set bmargin 0
set ylabel "price" offset 1
plot 'finance.dat' using 0:2:3:4:5 notitle with financebars lt 8, \
'finance.dat' using 0:9 notitle with lines lt 3, \
'finance.dat' using 0:10 notitle with lines lt 1, \
'finance.dat' using 0:11 notitle with lines lt 2, \
'finance.dat' using 0:8 axes x1y2 notitle with lines lt 4
unset label 1
unset label 2
unset label 3
unset title
set bmargin
set format x
set size 1.0, 0.3
set origin 0.0, 0.0
set tmargin 0
unset logscale y
set autoscale y
set format y "%1.0f"
set ytics 500
set xtics ("6/03" 66, "7/03" 87, "8/03" 109, "9/03" 130, "10/03" 151, "11/03" 174, "12/03" 193, "1/04" 215, "2/04" 235)
set ylabel "volume (0000)" offset 1
plot 'finance.dat' using 0:($6/10000) notitle with impulses lt 3, \
'finance.dat' using 0:($7/10000) notitle with lines lt 1
unset multiplot


Click here for minimal script to generate this plot

reset
set label 1 "Acme Widgets" at graph 0.5, graph 0.9 center front
set label 2 "Courtesy of Bollinger Capital" at graph 0.01, 0.07
set label 3 "  www.BollingerBands.com" at graph 0.01, 0.03
set logscale y
set yrange [75:105]
set ytics (105, 100, 95, 90, 85, 80)
set xrange [50:253]
set grid
set lmargin 9
set rmargin 2
set format x ""
set xtics (66, 87, 109, 130, 151, 174, 193, 215, 235)
set multiplot
set title "Change to candlesticks"
set size 1, 0.7
set origin 0, 0.3
set bmargin 0
set ylabel "price" offset 1
plot 'finance.dat' using 0:2:3:4:5 notitle with candlesticks lt 8, \
'finance.dat' using 0:9 notitle with lines lt 3, \
'finance.dat' using 0:10 notitle with lines lt 1, \
'finance.dat' using 0:11 notitle with lines lt 2, \
'finance.dat' using 0:8 axes x1y2 notitle with lines lt 4
unset label 1
unset label 2
unset label 3
unset title
set bmargin
set format x
set size 1.0, 0.3
set origin 0.0, 0.0
set tmargin 0
unset logscale y
set autoscale y
set format y "%1.0f"
set ytics 500
set xtics ("6/03" 66, "7/03" 87, "8/03" 109, "9/03" 130, "10/03" 151, "11/03" 174, "12/03" 193, "1/04" 215, "2/04" 235)
set ylabel "volume (0000)" offset 1
plot 'finance.dat' using 0:($6/10000) notitle with impulses lt 3, \
'finance.dat' using 0:($7/10000) notitle with lines lt 1
unset multiplot


Click here for minimal script to generate this plot

reset
set label 1 "Acme Widgets" at graph 0.5, graph 0.9 center front
set label 2 "Courtesy of Bollinger Capital" at graph 0.01, 0.07
set label 3 "  www.BollingerBands.com" at graph 0.01, 0.03
set logscale y
set yrange [75:105]
set ytics (105, 100, 95, 90, 85, 80)
set xrange [50:253]
set grid
set lmargin 9
set rmargin 2
set format x ""
set xtics (66, 87, 109, 130, 151, 174, 193, 215, 235)
set multiplot
set title "Change to Bollinger Boxes"
set size 1, 0.7
set origin 0, 0.3
set bmargin 0
set ylabel "price" offset 1
plot 'finance.dat' using 0:3:3:($2>$5?$2:$5):($2>$5?$2:$5) notitle with candlesticks lt 3, \
'finance.dat' using 0:($2<$5?$5:1/0):($2<$5?$5:1/0):($2<$5?$2:1/0):($2<$5?$2:1/0) notitle with candlesticks lt 2, \
'finance.dat' using 0:($2>$5?$2:1/0):($2>$5?$2:1/0):($2>$5?$5:1/0):($2>$5?$5:1/0) notitle with candlesticks lt 1, \
'finance.dat' using 0:($2<$5?$2:$5):($2<$5?$2:$5):4:4 notitle with candlesticks lt 3, \
'finance.dat' using 0:9 notitle with lines lt 3, \
'finance.dat' using 0:10 notitle with lines lt 1, \
'finance.dat' using 0:11 notitle with lines lt 2, \
'finance.dat' using 0:8 axes x1y2 notitle with lines lt 4
unset label 1
unset label 2
unset label 3
unset title
set bmargin
set format x
set size 1.0, 0.3
set origin 0.0, 0.0
set tmargin 0
unset logscale y
set autoscale y
set format y "%1.0f"
set ytics 500
set xtics ("6/03" 66, "7/03" 87, "8/03" 109, "9/03" 130, "10/03" 151, "11/03" 174, "12/03" 193, "1/04" 215, "2/04" 235)
set ylabel "volume (0000)" offset 1
plot 'finance.dat' using 0:($6/10000) notitle with impulses lt 3, \
'finance.dat' using 0:($7/10000) notitle with lines lt 1
unset multiplot


Click here for minimal script to generate this plot

reset